Copper Keeping Pace with the Trace
2019 年 2 月 25 日 / General, Installation and testing, Upgrading and troubleshooting
When it comes to Tier 2 fiber testing, there are many smart people in our industry who can read an OTDR trace and pinpoint the type and location of a fault within the cable. And for those who might not be proficient in reading a trace, Fluke Networks’ OptiFiber Pro OTDR features advanced logic that automatically interprets the trace to provide a detailed and graphical map of events that includes the location of connectors, splices and anomalies.
It’s no wonder that with their detailed traces and event maps, most fiber techs think they’re pretty cool and have an edge over copper when it comes to troubleshooting. But in fact, copper is keeping pace with the trace.
The Trained Eye
Like an OTDR that shows results within the time domain, Fluke Networks’ DSX series copper testers feature High-Definition Time Domain Reflectometry (HDTDR) and High Definition Time Domain Crosstalk (HDTDX) analyzers. HDTDR shows the locations and magnitudes of reflections caused by impedance variations, which can be analyzed to determine the reason why category cable fails or gives a marginal result for insertion loss and return loss. HDTDX traces can be analyzed to locate the distance to and the source of near end crosstalk (NEXT) events. But when it comes to reading an HDTDR or HDTDX trace, this too can take a trained eye.
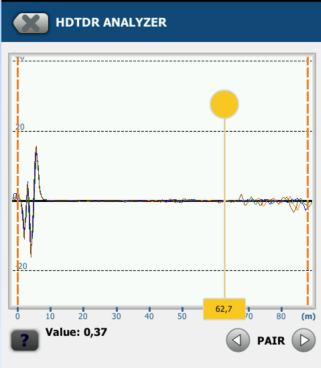
For example, in looking at the events in an HDTDR trace, there are two types to consider – bipolar or unipolar. A bipolar event contains a positive and negative characteristic, while a unipolar event is either positive OR negative. When using HDTDR, you may need to pinch and zoom to make the events more visible. Experienced users are interested in the amplitude and number of events in a trace. Internally we use a simple rule of thumb, if you have any events with and amplitude greater than 0.8% in the cable, especially if there are more than 4 of them, there may be a cable issue.
Return loss diagnosis is a matter of deduction, and a proficient HDTDR trace reader knows that the amount of return loss, if it occurs on one or all pairs and where it occurs along the cable can indicate different problems. The same holds true for analyzing an HDTDX trace. When a pair fails NEXT, a proficient HDTDX trace reader can determine if the problem is a termination issue and which connector is the problem.
When You Need a Map
Just like Tier 2 fiber testing, those technicians who aren’t proficient in reading traces might need a little help in interpreting HDTDR and HDTDX traces to determine the cause of failing links. Thankfully, there’s an easy-to-use event map for copper testing too.
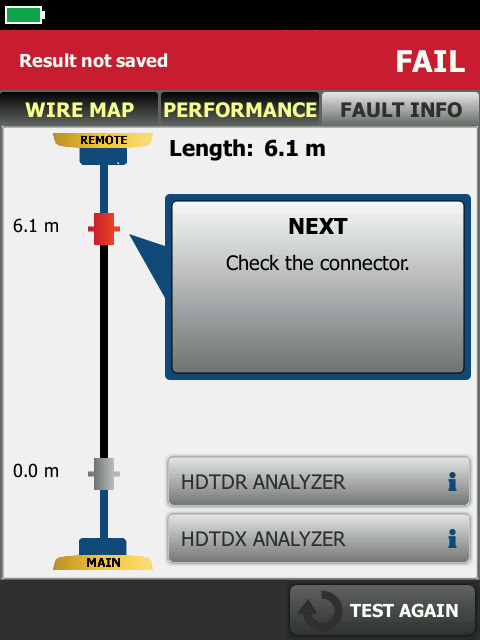
On the DSX series tester under the DIAGNOSTICS tab, the FAULT INFO feature interprets the HDTDR and HDTDX traces to show you distance to RJ45 connections in any link that is 100 meters long or less, and it will indicate the potential cause of insertion loss, return loss and NEXT failures. Potential faults detected include Insertion Loss failure due to lubricant or length and Return Loss failure due to a DC contact resistance issue, bad cable or water in the cable. Using the HDTDX technology, FAULT INFO can also detect NEXT failure caused by cable, a poor termination or non-compliant connector, or the use of too many connections for the link under test.
IIn addition to the potential cause and location, another unique feature of FAULT INFO is the ability to indicate specifically which problem to fix that will result in the largest improvement in NEXT. The connector marked in RED indicates that it is the largest source of NEXT. Note that Since Fault Info is identifying the most significant source of NEXT and/or Return Loss, this doesn’t mean that it is the only event. Also, if you have a cable issue and a connector issue, Fault Info will first call out the cable. Yes, the connectors may be bad, but we don’t want you to waste time replacing them before fixing the cable.
So while long live the fiber vs. copper debate, copper troubleshooting with its traces and event maps is just as cool – if you have a DSX CableAnalyzer!
最新报道 查看全部 >
什么是光纤?这里有一份指南
2024-03-20
网络和线缆测试终极指南
2024-03-13
选择绞合线缆还是实心线缆
2024-03-06
Fluke CableIQ™ 电缆鉴定测试仪与 LinkIQ™ 电缆 + 网络测试仪比较
2023-06-13
什么是回波损耗?
2023-02-14
布线认证比以往任何时候都更加重要的三个原因
2023-01-05
更多大众报道 查看全部 >
什么是光纤?这里有一份指南
2024-03-20
网络和线缆测试终极指南
2024-03-13
选择绞合线缆还是实心线缆
2024-03-06
如何延续 Versiv™ 投资的价值
2023-12-21
测试 MPTL 时正确方法是什么?
2023-08-22
承包商表示不值得冒逃避认证的风险
2023-07-06


©2006-2021 Fluke Corporation。保留所有权利。
RM2011, 20/F, SCITECH Tower, 22 Jianguomenwai Avenue, Chaoyang District, Beijing, China
地址:北京市朝阳区建国门外大街22号赛特大厦20层2011室
联系电话:400-8103435
沪ICP备11037028号-15![]()