A full version of LinkWare Stats is included in LinkWare PC..
Testing todays advanced cabling plants is so complex that a single Category 5e test report includes more than 400 data fields. 一般的作业都包括几百至几千的链路,即使您筛选所有的结果并且看到它们全都通过了测试,可关键问题依然存在。
-
您如何轻易地判断是否使用了一个不正确的测试规格呢?
-
Which adapter was used?
-
是否所有的测试仪都使用了正确的软件?
-
您是否得到了预期的余量?
-
它们是否一致?
Fluke Networks has the answer with LinkWare Stats, a results analysis software option that integrates with our LinkWare Cable Test Management Software. LinkWare Stats generates statistics on the cabling links within your LinkWare database then transforms the performance results into summary graphics that give you the analytical information you need, fast.
Whether youre a network owner, cabling contractor or manufacturer, now for the first time, you can quickly see the true performance of the entire cabling plant and spot any anomalies or inconsistencies.
An example of a LinkWare Stats report is available by clicking here (PDF 201 KB)
LinkWare has the flexibility to let you breakdown the results to floor level, as defined in ANSI/TIA/EIA-606-A. An example of a project broken down to building level is available by clicking here (4.6 MB) You will need Microsoft Internet Explorer 5.0 or higher to view the report.
LinkWare Stats works hand in hand with LinkWare cable test results management software. LinkWare gives you the power to manage results data from multiple testers with one single software application. LinkWare Stats gives you the statistical analysis and reporting power to move above and beyond page-per-link reports. It analyzes and transforms LinkWare cable test data into graphics that reveal your cabling plant performance summarizing your entire cabling infrastructure in a compact, graphical format that makes it easy to verify margins and spot anomalies.
-
Get a complete view of cabling plant performance in ways you havent seen before
-
Filter incoming data to highlight exactly what youre looking for
-
View graphs and tables that show margins by test standard, operator, location and other attributes
-
Eliminate the chance that an anomaly gets overlooked; graphs highlight marginal or failed links in color
-
Quickly and easily demonstrate that the installation meets warranty requirements
-
Win more business with professional and customized performance summary reports
LinkWare Stats gives you an instant overview of your installed cabling plants performance, with plenty of detail if you want it. 您是否得到承诺可获得限制线之上 3 dB 的净空值?In a simple picture, LinkWare Stats tells you if its there.
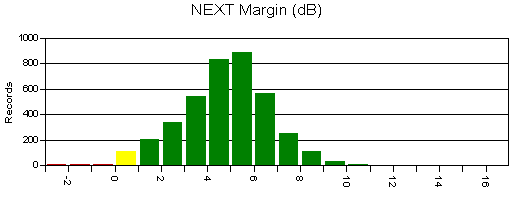
作业中所用的全部工具是否进行了正确的测试?
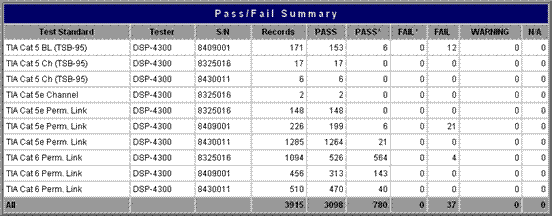
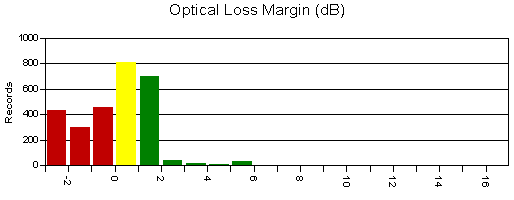
您可以一目了然。Want to know the margins for you Optical Fiber Test Results? Its all there for every measurement, floor, building, and test type.
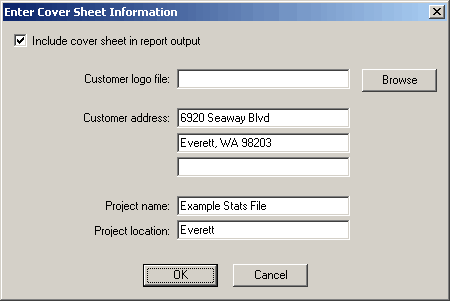
LinkWare Stats 使布线承包商更容易展示其专业水平及对质量的重视程度,这使他们能从激烈的行业竞争中脱颖而出。它提供了一个可定制的封面和整个安装工作的图形摘要,向客户证明您的工作质量。是否曾经历过在进行一项大工程时,经过一周测试之后才发现有人正在使用错误的测试标准或适配器?With LinkWare Stats, a quick review of the first days results immediately lets you know if youre on track as expected.
是否想过哪些组件在安装之后实际运行得更好?Its obvious with LinkWare Stats. 希望制造商尽快发布保修范围?LinkWare Stats presents test results the way manufacturers prefer to see them.
LinkWare Stats makes warranty review of installed results a breeze and provides useful data for future designs. At a glance, you can see which pairs had the worst results and at what frequencies they occurred.
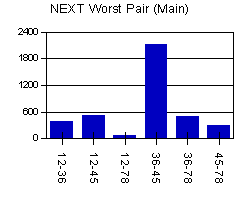 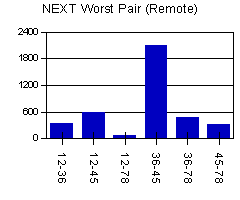
LinkWare Stats also allows analysis over a large population of installed products, so you can review performance by contractor. Whos doing the best terminations? If the average NEXT margins are 5 dB, why is one cluster of results only 2 dB? Are your near and far-end results consistent?
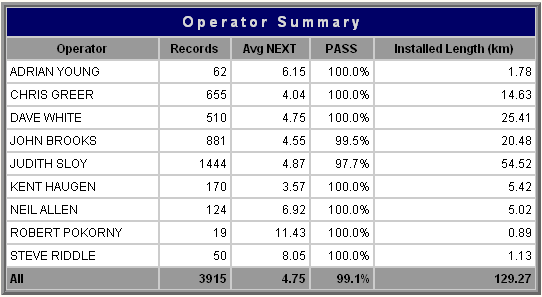
Tired of thumbing through binders of printed test results? Analyze 500 links in minutes with LinkWare Stats. Preview the results before compiling a report.
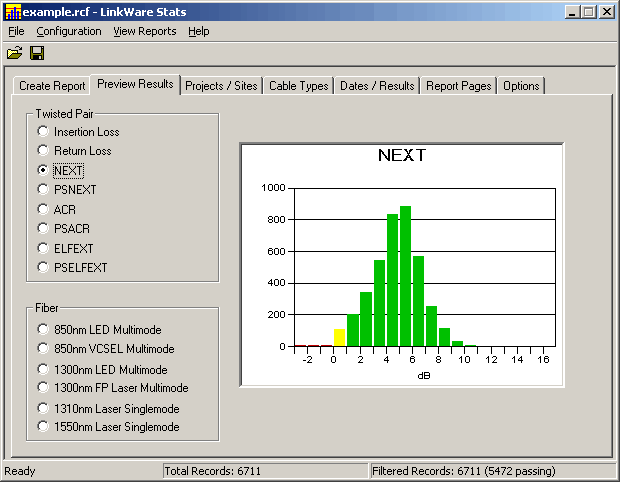
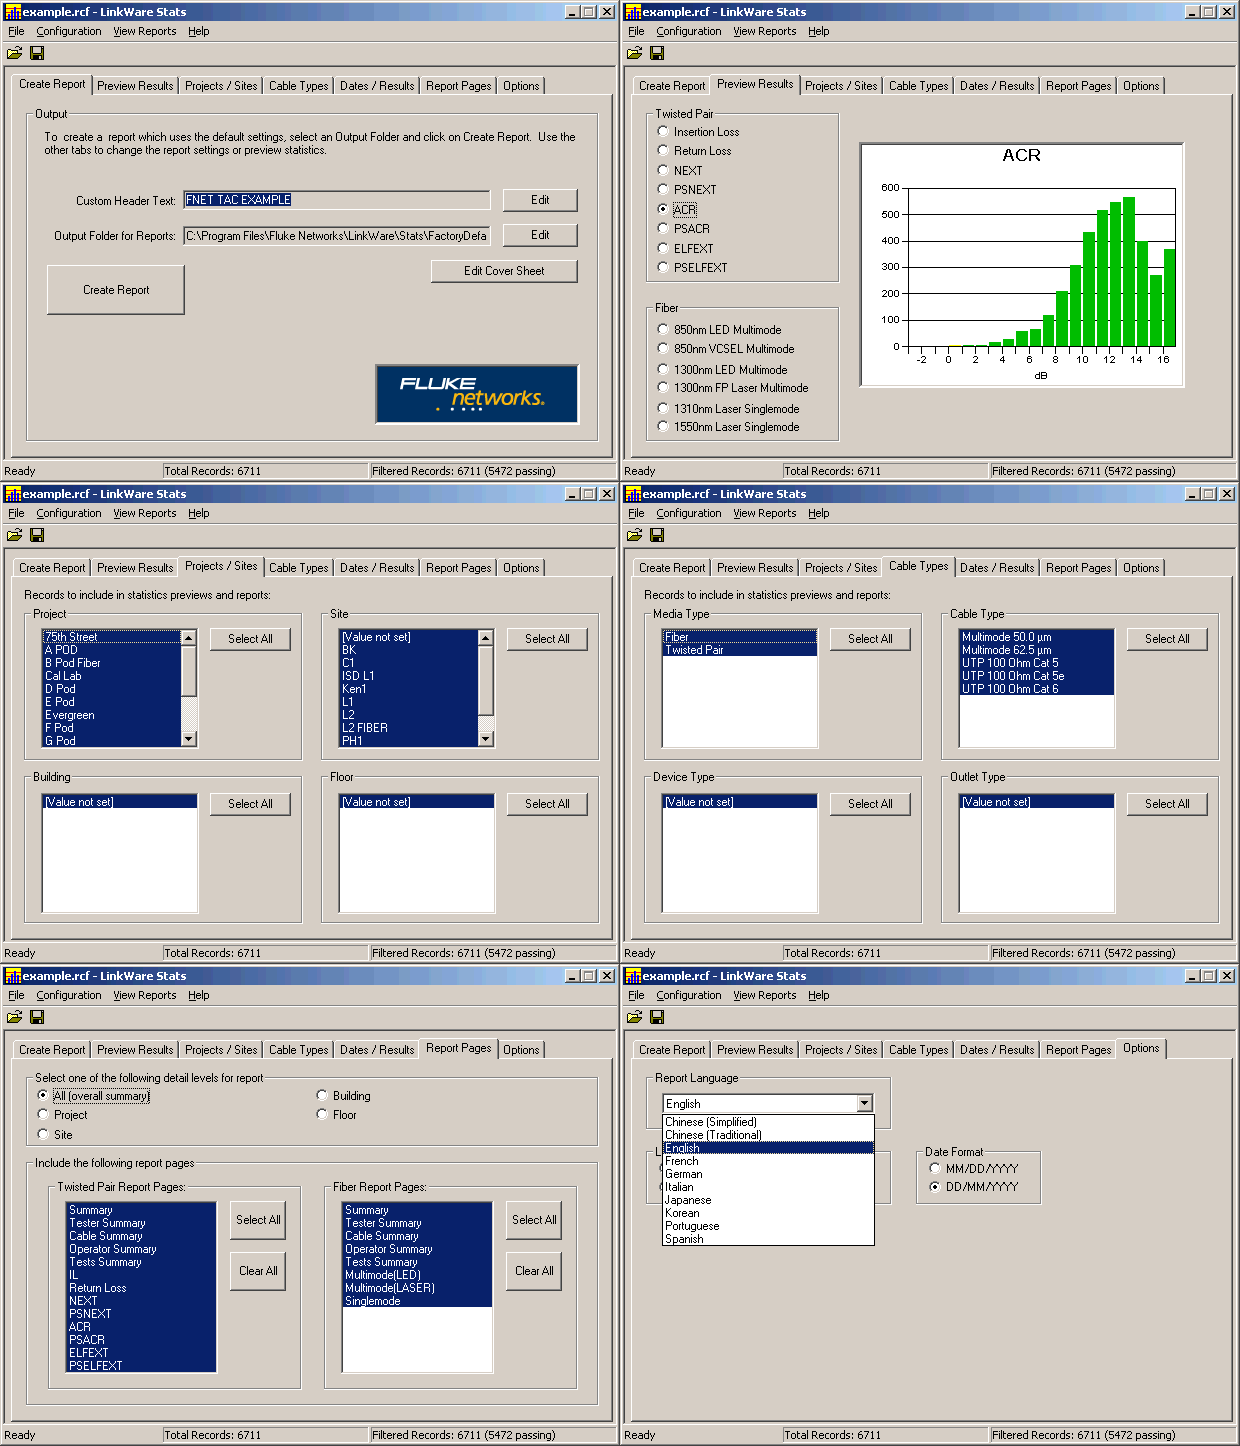
Start with the default setup, add a cover page with your company logo, select the report page types, and preview a sample. One setup is all it takes to save the configuration so you can produce it again easily.
|


